ME Housing Affordability Tracker and Market Position Index
In this Memo, we highlight the latest capability to assess New Zealand’s housing markets via the ME Housing Affordability Tracker. This enables cities and districts to measure and monitor changes in housing supply and affordability in their urban environments. It is part of M.E’s evolving and expanding toolkit to monitor market performance and support actions to improve housing affordability.
Housing supply and affordability remain at the forefront of economic policy, as the Government seeks a more responsive development environment through:
the re-set of planning via RMA reform, and
enabling more development through fast-tracking.
Delivery of the first project approved under the Fast Track Approval Act (Auckland Port) is due to get underway this year, and there is an ambitious timetable to have new resource management legislation in place by 2027. The current downturn in the economy highlights the importance of both these initiatives to enable and achieve growth in the economy, especially in housing.
The focus on housing affordability remains strong. Much of our research in the last five years has been to support council compliance with National Policy Statement on Urban Development (NPS-UD) requirements for their housing and business sectors. Over that period, there has been a shift in the research emphasis from substantial and detailed analysis of demand, capacity, feasibility and sufficiency in order to demonstrate compliance per se, toward an assessment of how different policy and planning options may help achieve the aims of national housing policies, such as improving housing affordability. The requirement for robust modelling and analysis has intensified. Improvements in methods and data sources have seen substantial gains in efficiency, scope and monitoring speed, allowing greater emphasis on what zoning and policy settings may mean ‘on the ground’ and in real-life terms.
The M.E Housing Affordability Tracker integrates demand and supply dynamics to examine the potential for affordable ownership for non-owner households – a major goal of the national policy settings. The Housing Affordability Tracker:
provides timely insights into how markets are performing,
supports monitoring demand and supply shifts across market segments,
shows how different dwelling supply structures can contributing to affordability, over time.
A major focus in developing the Tracker has been to make available to councils better market information about their housing sectors, in a timely and cost-effective manner. This includes to support compliance with the NPS-UD reporting and monitoring, and more broadly to help enhance urban and housing planning. The most recent advances are the timeliness of market information on how new housing supply is responding to plan provisions, and clearer illustration of how changes in supply are contributing to affordability and ownership.
About the Housing Affordability Tracker
The Tracker is a tool showing changes in supply and affordability through time for any local (city or district) housing market. Its tangible outputs are in terms of numbers of households and numbers of dwellings, as the outcomes to be linked with policy and plan settings. By directly comparing demand and supply at each price point, it shows the overall market situation at any time, and by tracking change over time it shows whether or not housing affordability is improving, and by how much, and for which household segments. Moreover, it incidentally covers most aspects of the NPS-UD reporting (Subpart 5) and monitoring (s3.9), drawing aspects together to show the overall affordability picture.
This information support sound monitoring, and can assist councils to keep their fingers ‘on the pulse’, while also offering direction to fine tune planning responses in a timely manner. Making direct the link between housing demand as numbers of non-owner households (by segment) and housing supply (by typology and price band) is a good way to do this.
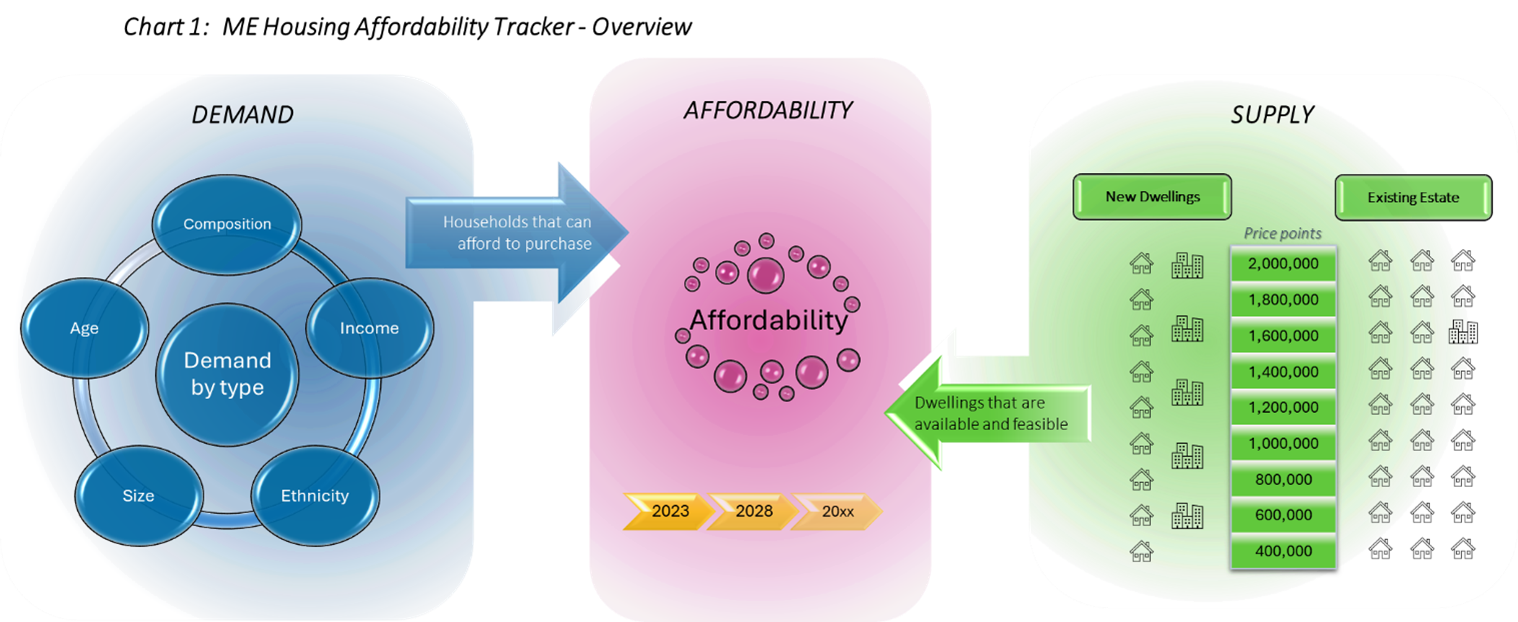
The main elements in the Tracker are shown in Chart 1:
scale of demand or need - the numbers of non-owner households in each segment of the market, using detailed Census 2023 data updated for growth trends
new dwelling supply – numbers of new dwellings, at each price point, by typology
existing dwelling supply – the existing estate by price point and typology, the other main route to dwelling ownership
housing price inflation – how this affects supply in each value band
dwelling costs – since consent values are only part of final value
un-met demand - scale and nature of un-met demand
trends in new dwelling supply by market positioning
The affordability picture is important. It is directly relevant to the NPS-UD objectives and requirements to identify how many of the new dwellings being supplied are at affordable price points for segments of the non-owner market, and the numbers of existing dwellings coming to the market. The Tracker shows how many dwellings at each price point would be required to enable ownership for every household in each segment, or a targeted share. It identifies the key characteristics of those households to inform the nature of the housing required. It is designed to inform and support many of the HBA-related analysis and requirements.
The affordability of housing varies significantly among household segments, driven especially by income levels and current ownership status, and the supply side of the equation, as new dwellings are constructed, and existing dwellings become available in the market. The Tracker captures the progressive (quarterly) shift in a market, focusing on the extent to which new dwelling supply (for growth and replacement) is providing opportunity for non-owner households to move into ownership. The opportunities are matched to household segments according to what they can afford and how many dwellings in affordable price bands are being delivered (new) or becoming available through ‘churn’ in the existing dwelling estate.
The Tracker does not claim to show actual outcomes – dwellings in any price band are on offer to all potential purchasers, owners and non-owners. However, identifying how the market is providing opportunity is an important indicator of the outcomes of plans and policies.
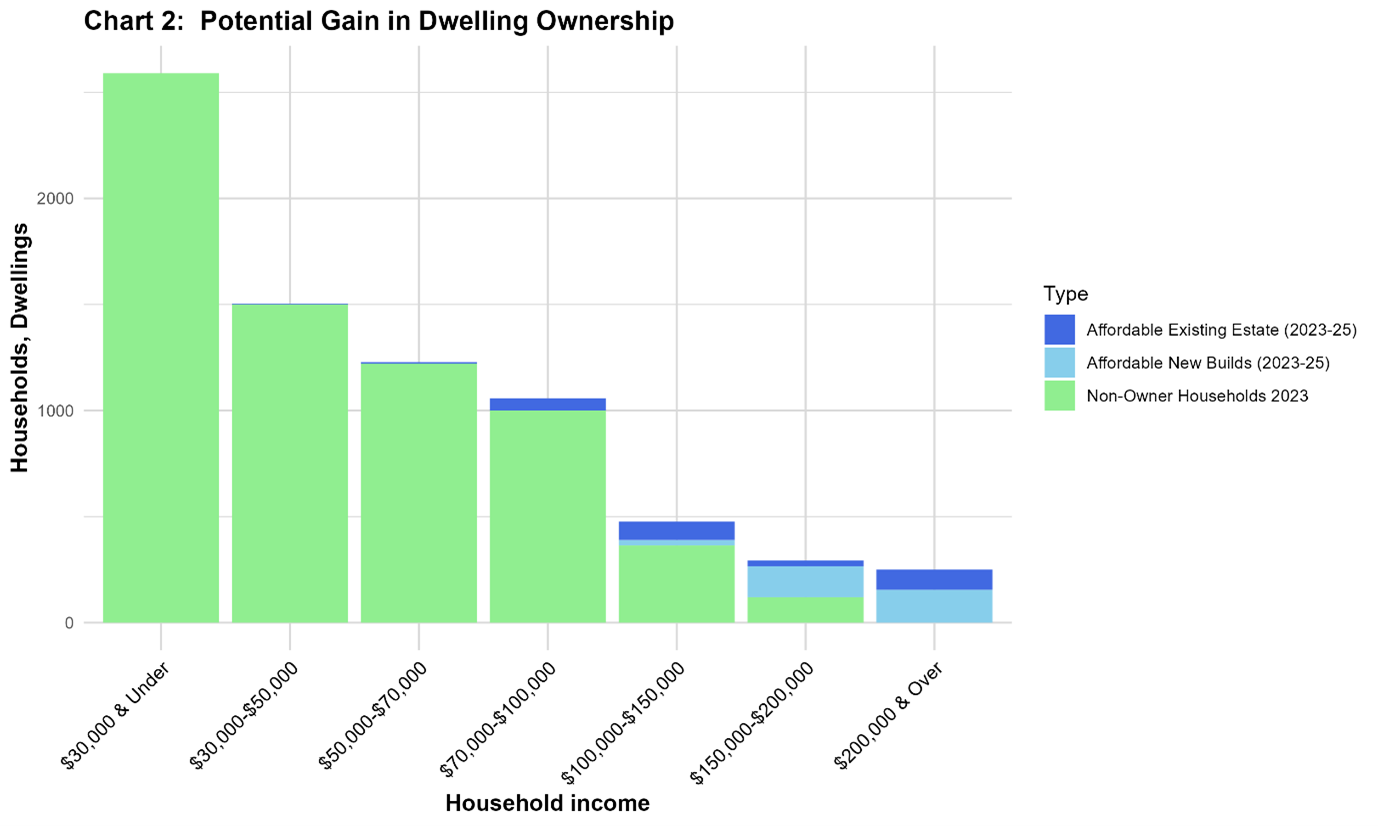
Chart 2 displays the total numbers of non-owner households in each income / affordability band, with the blue and green segments on each bar showing the extent to which the market is providing opportunity for those households to become owners. This brings together the size and nature of demand for affordable housing, and places the supply side in that context.
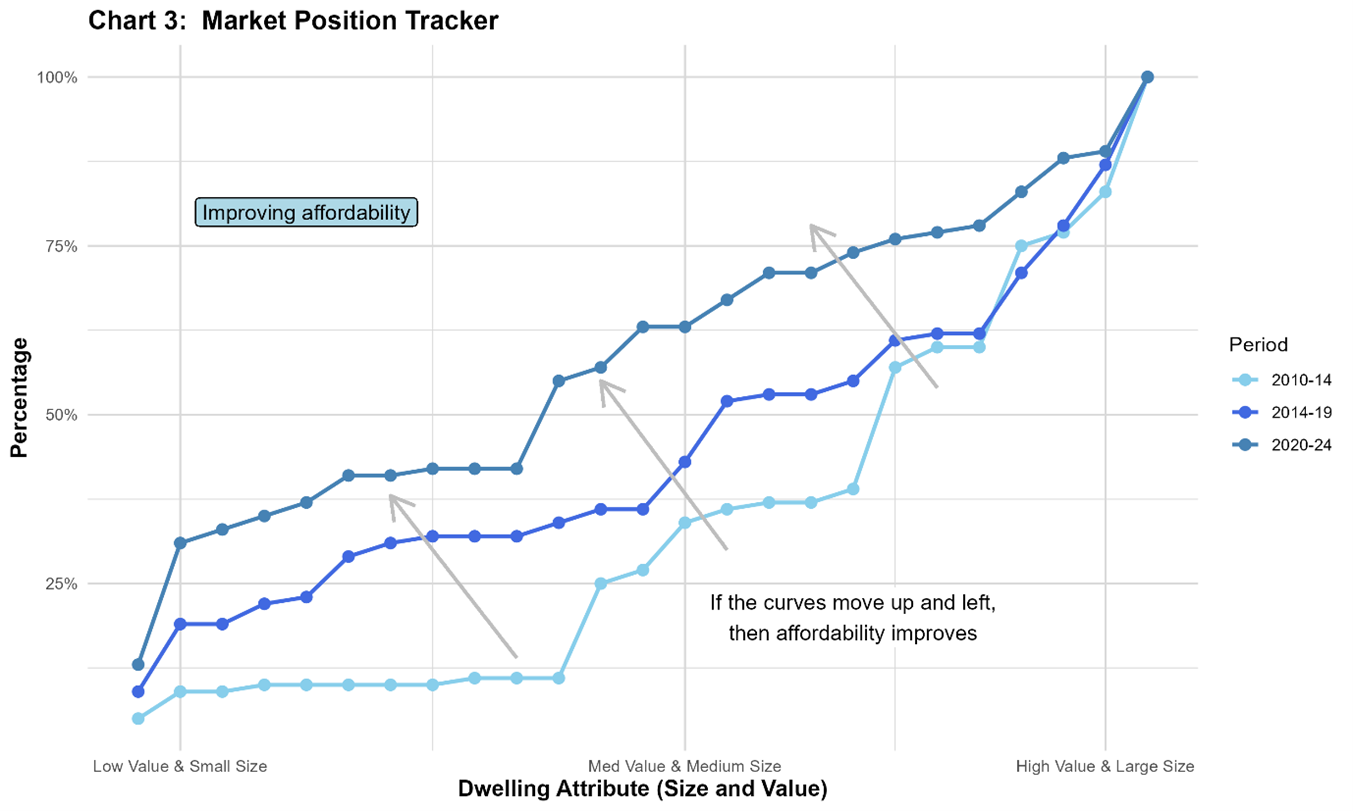
Rich supply-side detail
As part of the Tracker, rich supply-side detail is provided, the Market Position Index shows how the market is contributing to affordability objectives through new dwellings supplied (especially through smaller dwellings and/or lower values or values per m2), key aspects which are influenced by the types of development opportunity provided.
The Index draws together the numbers and dimensions of new dwelling supply for each dwelling typology (stand-alone houses, units and terrace houses, apartments, retirement units). Chart 3 reflects part of the Index, plotting the mix of dwelling size and value combinations over time to indicate if new supply is becoming more affordable or less affordable in that TLA. An increase in the share of new dwellings in smaller and lower value bands sees the total supply curve shift upward and left, portraying an overall improvement in affordability (the Chart shows actuals for one TLA over the last 14 years). This consent data is complemented with customised datasets from Cotality of actual new dwellings, to show how consented dwellings translate to new dwellings in each value band (construction, other improvements, land) as final values/ prices to purchasers.
This Tracker is expressed as an Index Value to show how each TLA market shifts over time, and in relation to the national pattern.
Concluding remark
These tools provide a useful way to effectively monitor housing markets and affordability patterns, covering core aspects required by the NPS-UD. They go beyond basic indicators to show in a timely way implications for people and households in a city or district, and how these are influenced by the types of development opportunities provided to the market.
Douglas Fairgray
doug@me.co.nz
Mobile: 021 579 786